🧭 Introduction: The Imperative of Observability
In the rapidly evolving landscape of software development, observability has emerged as a critical component for ensuring system reliability and performance. Traditional monitoring approaches, while useful, often fall short in providing the depth and context required to understand complex, distributed systems. This is where observability steps in, offering a more comprehensive view by collecting and analyzing telemetry data such as logs, metrics, and traces.
📈 Understanding the Observability Maturity Model
The observability maturity model serves as a framework for organizations to assess and enhance their observability practices. It outlines a progression through various stages, each representing a deeper level of insight and control over system behavior.DuploCloud+1DATAVERSITY+1
Level 1: Basic Monitoring
-
Focuses on collecting fundamental metrics like CPU usage, memory consumption, and uptime.
-
Utilizes simple dashboards and alerting mechanisms.
Level 2: Enhanced Monitoring
-
Incorporates more detailed metrics and logs.
-
Introduces basic correlation between different data sources.HubSpot
Level 3: Full-Stack Observability
-
Combines metrics, logs, and traces for a comprehensive view.
-
Enables root cause analysis and performance optimization.Imply+12New Relic+12Informa TechTarget+12
Level 4: Intelligent Observability
-
Leverages machine learning and advanced analytics.
-
Provides predictive insights and automated anomaly detection.
Level 5: Federated Observability
-
Integrates observability across multiple teams and systems.
-
Facilitates organization-wide visibility and decision-making.
Visual Representation:

🛠️ Key Tools Facilitating Observability
Several tools have become integral to achieving observability maturity:AWS Observability+1Informa TechTarget+1
-
Prometheus: An open-source monitoring system that collects and stores metrics as time series data.Tracetest+1Grafana Labs+1
-
Grafana: A visualization tool that integrates with Prometheus and other data sources to create interactive dashboards.LinkedIn
-
Jaeger: An open-source, end-to-end distributed tracing tool.
-
Datadog: A monitoring and analytics platform for cloud-scale applications.Tracetest+1Medium+1
-
Honeycomb: A tool designed for high-cardinality data analysis, enabling deep insights into application behavior.Uptrace
Example Dashboard:

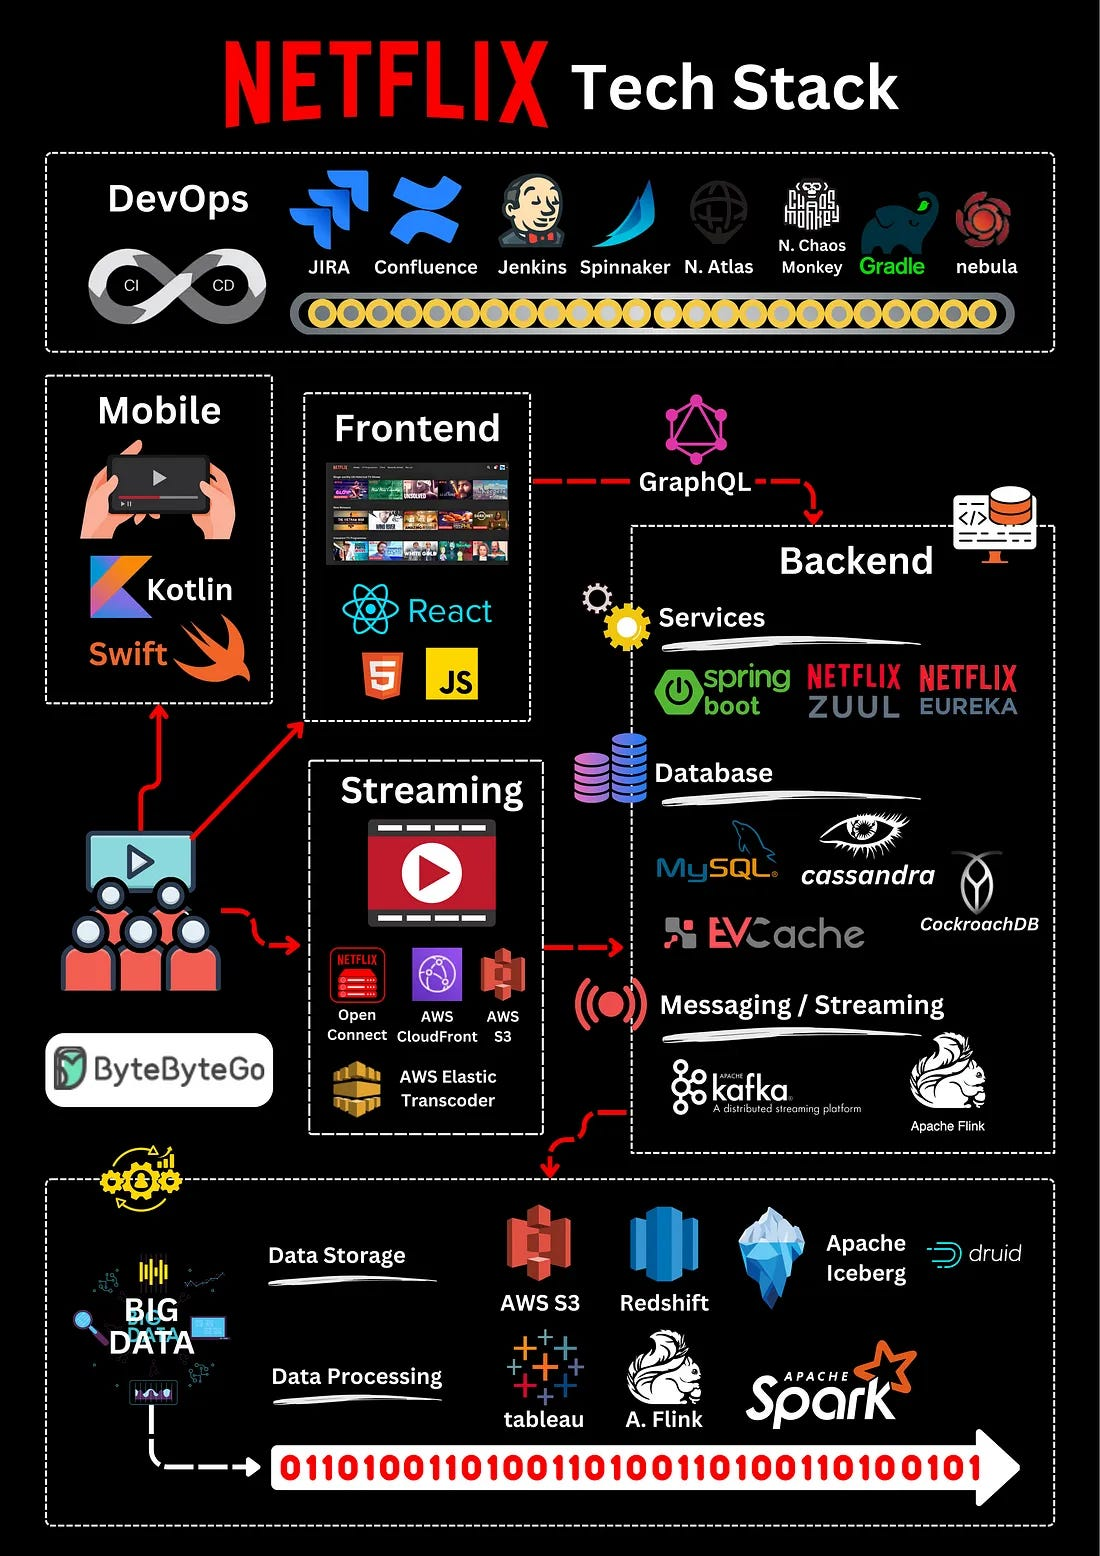
📊 Case Study: Netflix's Observability Journey
Netflix, a pioneer in streaming services, has developed sophisticated observability tools to manage its complex infrastructure. Their in-house platform, Atlas, is designed to handle real-time telemetry data, providing insights into system performance and user experience. By integrating observability into their development and operations processes, Netflix ensures high availability and rapid issue resolution.LinkedIn+1InfoQ+1
System Architecture:
📚 Conclusion: Embracing Observability for DevOps Success
Observability is not merely a technical enhancement but a strategic imperative in the journey toward DevOps maturity. By systematically advancing through the maturity levels and leveraging the appropriate tools, organizations can achieve faster, more reliable, and scalable software delivery.
📅 Next in the Series:
“Evolving Testing Maturity: The Engine of Software Reliability”