Friday, December 03, 2021

Build and Release Management — Unlocking Continuous Delivery


🧭 Introduction: The Imperative of Build and Release Management

In the rapidly evolving landscape of software development, efficient build and release management has become a cornerstone of successful DevOps practices. By automating and streamlining the processes of building, testing, and deploying applications, organizations can achieve faster release cycles, improved software quality, and enhanced collaboration between development and operations teams.


🧱 Understanding the Build and Release Management Maturity Model

The maturity of build and release management practices can be assessed through a multi-level model:

  • Level 1: Manual Processes
    Builds and deployments are performed manually, often leading to inconsistencies and errors.

  • Level 2: Scripted Automation
    Basic scripts automate some aspects of the build and deployment process, reducing manual effort but lacking integration and scalability.

  • Level 3: Continuous Integration (CI)
    Automated tools continuously integrate code changes, run tests, and generate build artifacts, enhancing code quality and early defect detection.

  • Level 4: Continuous Delivery (CD)
    Automated pipelines enable the deployment of applications to staging environments, with manual approvals for production releases.

  • Level 5: Continuous Deployment
    Fully automated pipelines deploy applications to production environments without manual intervention, ensuring rapid and reliable releases.


🛠️ Key Tools Facilitating Build and Release Management

Several tools have become integral to achieving build and release management maturity:

  • Jenkins: An open-source automation server that supports building, testing, and deploying applications.

  • GitHub Actions: A CI/CD platform that allows automation of workflows directly from GitHub repositories.Wikipedia+1Wikipedia+1

  • GitLab CI/CD: An integrated CI/CD tool within GitLab that automates the software delivery process.Spacelift+1Reddit+1

  • Azure Pipelines: A cloud-based CI/CD service that supports building, testing, and deploying applications to various platforms.

  • Argo CD: A declarative, GitOps continuous delivery tool for Kubernetes that synchronizes application state with Git repositories.


📈 Case Study: Enhancing Build and Release Management in a Tech Company

A leading technology company faced challenges with slow release cycles and frequent deployment errors. By implementing Jenkins for automated builds and tests, and Argo CD for continuous delivery, they achieved:

  • 50% Reduction in Deployment Time: Automated pipelines accelerated the release process.

  • 30% Decrease in Deployment Failures: Early detection of issues through automated testing improved reliability.

  • Enhanced Collaboration: Integration of tools facilitated better communication between development and operations teams.


📊 Visualizing the Continuous Delivery Pipeline


This diagram illustrates the stages of a continuous delivery pipeline, from code commit to deployment, highlighting the automation and integration at each step.


📚 Conclusion: Embracing Build and Release Management for DevOps Success

Effective build and release management is essential for organizations aiming to achieve DevOps maturity. By adopting automated tools and practices, teams can enhance software quality, accelerate release cycles, and foster a culture of continuous improvement.


📅 Next in the Series:
“DevSecOps in Practice: Embedding Security into Every Commit”

Monday, November 22, 2021

Evolving Testing Maturity — The Engine of Software Reliability


🧭 Introduction: The Imperative of Testing Maturity

In the dynamic world of software development, testing has transitioned from a peripheral activity to a central pillar of the DevOps lifecycle. The evolution of testing maturity reflects the industry's shift towards automation, continuous integration, and early defect detection. Understanding and advancing through the stages of testing maturity is crucial for organizations aiming to deliver reliable and high-quality software products.


📈 Understanding the Testing Maturity Model

The Testing Maturity Model provides a framework for assessing and enhancing an organization's testing practices. It outlines a progression through various levels, each representing a deeper integration of testing into the development process:

Level 1: Initial

Level 2: Managed

  • Basic testing processes are established.

  • Introduction of test planning and tracking.TestMatick

Level 3: Defined

  • Testing processes are standardized and documented.

  • Integration of testing into the development lifecycle.

Level 4: Measured

Level 5: Optimized

  • Testing processes are continuously refined based on metrics and feedback.

  • Emphasis on prevention of defects rather than detection.

Visual Representation:


🛠️ Key Practices and Tools for Advancing Testing Maturity

Advancing through the testing maturity levels involves the adoption of various practices and tools:

  • Test Automation: Implementing automated testing tools such as Selenium, JUnit, and TestNG to increase efficiency and coverage.

  • Continuous Integration (CI): Integrating testing into the CI pipeline using tools like Jenkins and Travis CI to ensure immediate feedback on code changes.

  • Behavior-Driven Development (BDD): Utilizing frameworks like Cucumber to align testing with business requirements.

  • Performance Testing: Employing tools such as JMeter and LoadRunner to assess system performance under load.

  • Security Testing: Incorporating security testing tools like OWASP ZAP to identify vulnerabilities early in the development process.


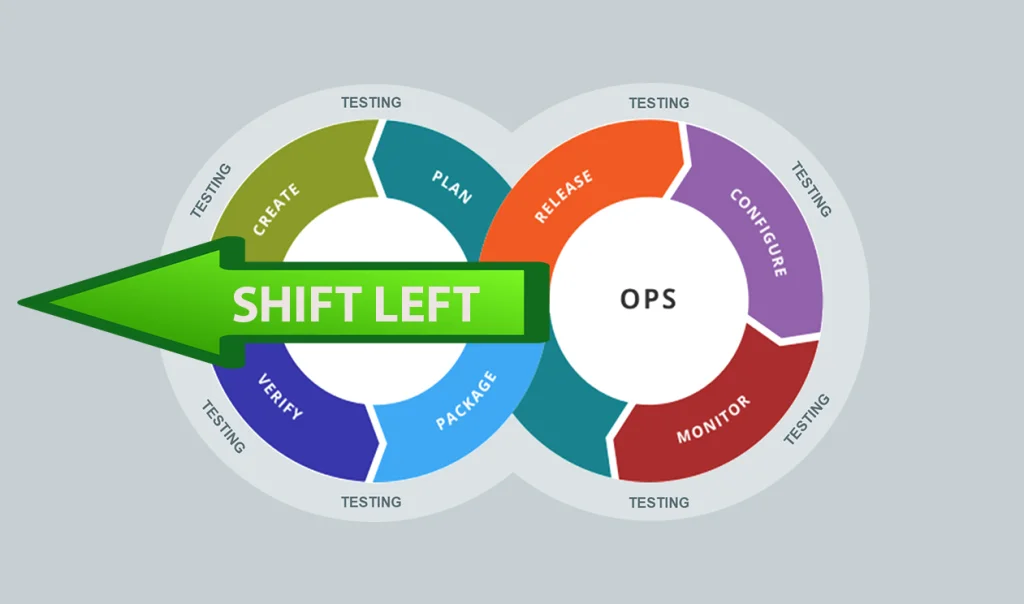
🔄 Shift-Left Testing: Integrating Testing Early in the Development Cycle

Shift-left testing emphasizes the importance of incorporating testing activities early in the software development lifecycle. By doing so, defects can be identified and addressed promptly, reducing the cost and effort associated with late-stage bug fixes. This approach aligns with DevOps principles, promoting collaboration between development and testing teams from the outset.en.wikipedia.orgKatalon AI Test Automation

Visual Representation:


📊 Case Study: Enhancing Testing Maturity in a Financial Services Firm

A leading financial services firm recognized the need to improve its testing practices to enhance software quality and reduce time-to-market. By adopting automated testing tools and integrating testing into their CI/CD pipeline, the firm achieved the following outcomes:

  • 50% Reduction in Defect Leakage: Early detection of defects prevented them from reaching production.

  • 30% Improvement in Test Coverage: Automated tests increased the breadth and depth of testing.

  • 20% Decrease in Time-to-Market: Streamlined testing processes accelerated release cycles.


📚 Conclusion: The Path to Testing Excellence

Advancing testing maturity is a continuous journey that requires commitment, collaboration, and the right set of tools and practices. By embracing automated testing, integrating testing into the development process, and fostering a culture of continuous improvement, organizations can enhance software quality, reduce risks, and deliver value to customers more efficiently.


📅 Next in the Series:
“Build and Release Management: Unlocking Continuous Delivery”

Sunday, October 03, 2021

From Logs to Insight — Telemetry and Observability at Scale


🧭 Introduction: The Imperative of Observability

In the rapidly evolving landscape of software development, observability has emerged as a critical component for ensuring system reliability and performance. Traditional monitoring approaches, while useful, often fall short in providing the depth and context required to understand complex, distributed systems. This is where observability steps in, offering a more comprehensive view by collecting and analyzing telemetry data such as logs, metrics, and traces.


📈 Understanding the Observability Maturity Model

The observability maturity model serves as a framework for organizations to assess and enhance their observability practices. It outlines a progression through various stages, each representing a deeper level of insight and control over system behavior.DuploCloud+1DATAVERSITY+1

Level 1: Basic Monitoring

  • Focuses on collecting fundamental metrics like CPU usage, memory consumption, and uptime.

  • Utilizes simple dashboards and alerting mechanisms.

Level 2: Enhanced Monitoring

  • Incorporates more detailed metrics and logs.

  • Introduces basic correlation between different data sources.HubSpot

Level 3: Full-Stack Observability

Level 4: Intelligent Observability

  • Leverages machine learning and advanced analytics.

  • Provides predictive insights and automated anomaly detection.

Level 5: Federated Observability

  • Integrates observability across multiple teams and systems.

  • Facilitates organization-wide visibility and decision-making.

Visual Representation:


🛠️ Key Tools Facilitating Observability

Several tools have become integral to achieving observability maturity:AWS Observability+1Informa TechTarget+1

  • Prometheus: An open-source monitoring system that collects and stores metrics as time series data.Tracetest+1Grafana Labs+1

  • Grafana: A visualization tool that integrates with Prometheus and other data sources to create interactive dashboards.LinkedIn

  • Jaeger: An open-source, end-to-end distributed tracing tool.

  • Datadog: A monitoring and analytics platform for cloud-scale applications.Tracetest+1Medium+1

  • Honeycomb: A tool designed for high-cardinality data analysis, enabling deep insights into application behavior.Uptrace

Example Dashboard:


📊 Case Study: Netflix's Observability Journey

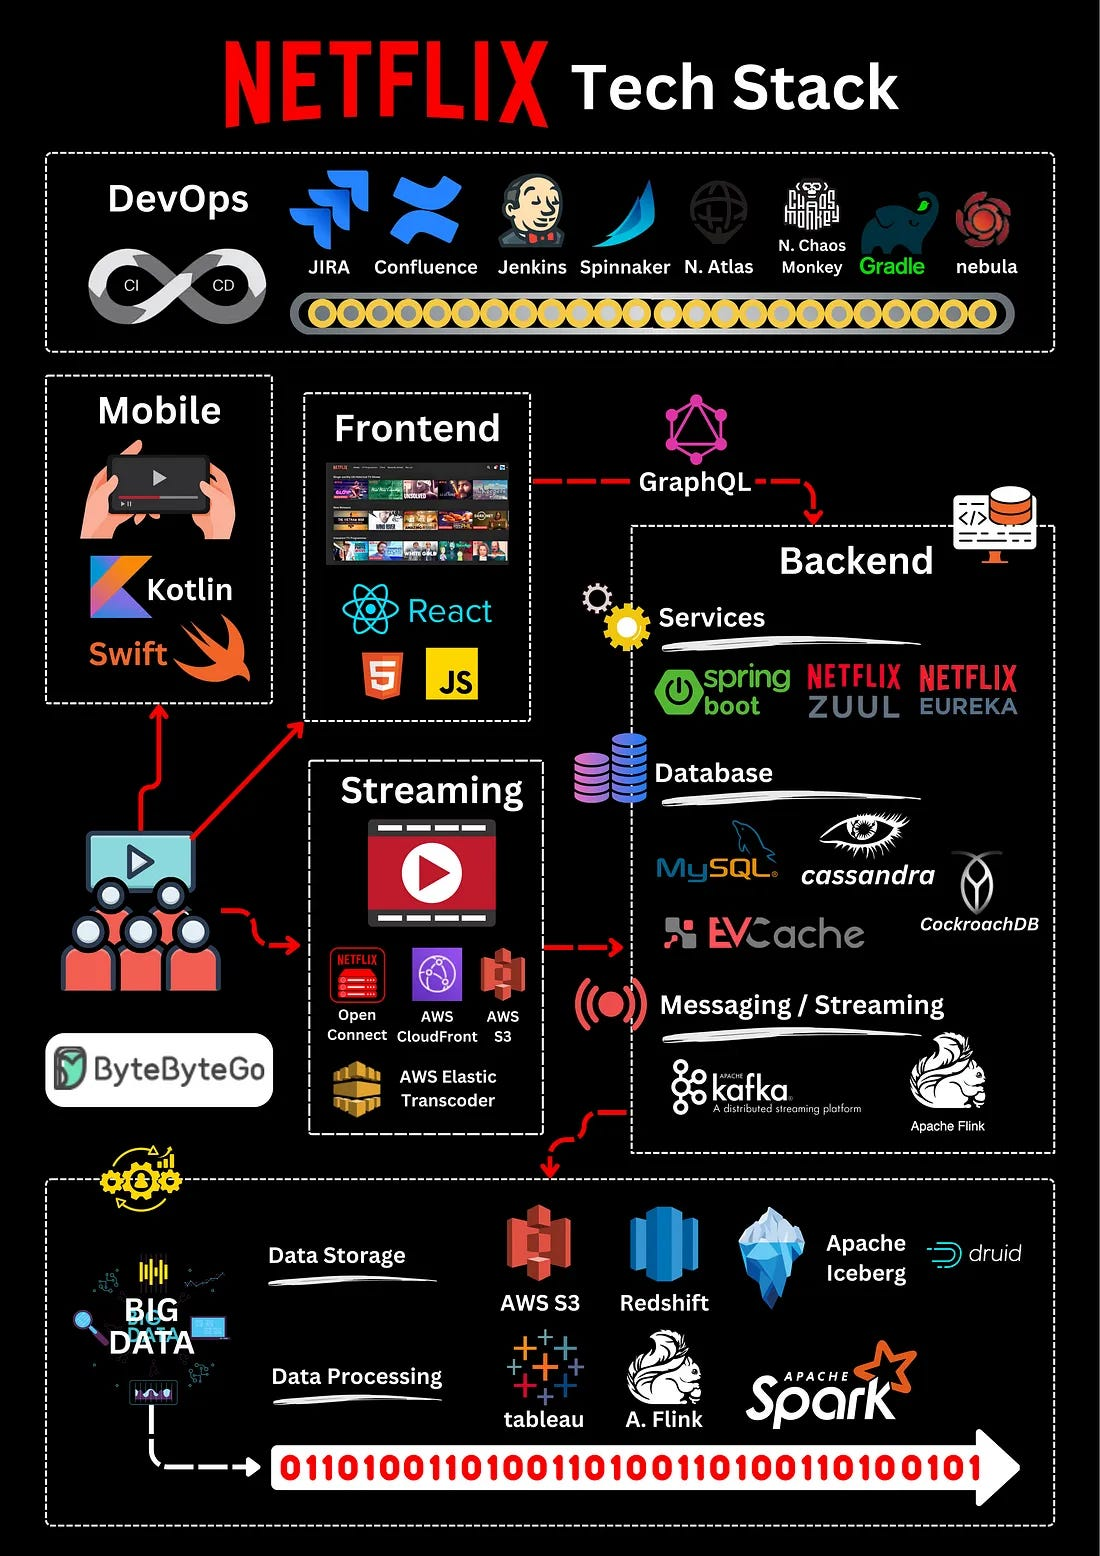
Netflix, a pioneer in streaming services, has developed sophisticated observability tools to manage its complex infrastructure. Their in-house platform, Atlas, is designed to handle real-time telemetry data, providing insights into system performance and user experience. By integrating observability into their development and operations processes, Netflix ensures high availability and rapid issue resolution.LinkedIn+1InfoQ+1

System Architecture:


📚 Conclusion: Embracing Observability for DevOps Success

Observability is not merely a technical enhancement but a strategic imperative in the journey toward DevOps maturity. By systematically advancing through the maturity levels and leveraging the appropriate tools, organizations can achieve faster, more reliable, and scalable software delivery.


📅 Next in the Series:
“Evolving Testing Maturity: The Engine of Software Reliability”

Monday, September 13, 2021

Designing a Scalable, Secure, and Resilient BPA Platform

Introduction

Behind every effective Business Process Activity Monitoring (BPA) system is an architecture designed for durability, performance, and security. A well-architected platform can scale effortlessly with growing business demands, protect sensitive data, and recover quickly from failures. In this post, we explore the foundational principles of building a BPA system that is scalable, secure, and resilient.


1. The Pillars of BPA System Architecture

Designing a robust BPA system means balancing three core capabilities:

  • Scalability: Ability to handle increasing event volume without degradation.

  • Security: Protecting data in motion and at rest.

  • Resilience: Ensuring continuous operation in the face of system or network failures.

Let’s explore each pillar and how to achieve it.


2. Scalable Architecture: Building for Growth

Scalability Strategies:

  • Kafka Partitioning: Distributes workload across multiple brokers and consumers.

  • Flink Parallelism: Enables distributed processing across nodes, speeding up computation.

  • Autoscaling Clusters: Use Kubernetes (K8s) or Azure Kubernetes Service (AKS) to scale processing clusters dynamically.

Example from SCM BPA:
The platform handled surges in event volume during peak retail periods by horizontally scaling Kafka and Flink deployments.

Diagram:
Scalable BPA Architecture


3. Fault Tolerance and High Availability

Key Practices:

  • Kafka Replication: Ensure each topic has multiple replicas to avoid data loss.

  • Flink Checkpointing: Periodically saves the job state for recovery after crashes.

  • Multi-Zone Deployments: Distribute services across availability zones to avoid single points of failure.

  • Stateless Design: Where possible, keep services stateless to simplify recovery.

Alerting Example:
If a Flink job fails, the system automatically restarts it from the last checkpoint.

Visual Aid:
High Availability Pipeline


4. Security: Protecting Data and Workflows

Security Measures:

  • TLS Encryption: Secure all data in transit (Kafka topics, APIs).

  • At-Rest Encryption: Protect storage layers using Azure-managed keys or HashiCorp Vault.

  • Authentication and Authorization:

    • OAuth2, SAML for user authentication

    • RBAC (Role-Based Access Control) to limit access

Audit Logging:
Track all user actions, data accesses, and configuration changes for compliance.

SCM BPA Example:
Multi-factor authentication (MFA) was enforced across user dashboards and admin consoles.


5. Observability and Monitoring

A resilient system is not just one that can recover—it’s one that knows when and why something went wrong.

Tools and Techniques:

  • Grafana + Prometheus: Monitor CPU, memory, latency, and Kafka/Flink-specific metrics.

  • Splunk: Ingest and analyze logs for anomaly detection.

  • Synthetic Monitoring: Use simulated transactions to test system performance.

Key Metrics to Track:

  • Kafka Consumer Lag

  • Flink Checkpoint Duration

  • Event Throughput per Topic

  • Dashboard Latency

Visual Example:
Monitoring Dashboard


6. Automation and CI/CD Pipelines

Reliable BPA platforms leverage automation for deployment, recovery, and updates.

DevOps Practices:

  • Infrastructure as Code (IaC) using Terraform or Bicep

  • CI/CD pipelines for Flink job updates and Power BI dashboards

  • Health checks and automated rollbacks

SCM BPA Example:
The team used GitHub Actions to deploy new Flink jobs with validation tests before promotion to production.


7. Disaster Recovery and Business Continuity

Planning for failure is critical to building trust in your platform.

Key Tactics:

  • Cross-Region Replication: For Kafka and storage layers

  • Cold and Warm Standby Environments

  • Recovery Playbooks: Step-by-step guides for platform restoration

Test Your Plan:
Run scheduled disaster recovery drills to ensure readiness.


Conclusion

Scalability, security, and resilience aren’t optional—they are the foundation of a sustainable BPA platform. By leveraging distributed architectures, enforcing security best practices, and embracing observability, you can build a system that evolves with your business and safeguards mission-critical data.

In our next post, we’ll shift focus to the human side of BPA systems—exploring how dashboards, alerts, and UX design empower business users to take action.

Stay tuned for Blog 6: The Human Side of BPA—Dashboards, Alerts, and Decision-Making.

Mastering Deployment Automation — The First Step Toward DevOps Maturity

🧭 Introduction: The Imperative of Deployment Automation

In the rapidly evolving landscape of software development, deployment automation has emerged as a cornerstone of DevOps maturity. Manual deployment processes are not only time-consuming but also prone to errors, leading to increased downtime and reduced reliability. Automating deployments ensures consistency, accelerates release cycles, and enhances overall software quality.


🧱 Understanding Deployment Automation Maturity Levels

Deployment automation maturity can be categorized into distinct levels, each representing a progression in automation capabilities:

  • Level 1: Manual Deployments
    Deployments are executed manually, often involving complex scripts and human intervention. This approach is error-prone and lacks scalability.

  • Level 2: Scripted Deployments
    Basic automation is introduced through scripts, reducing manual effort but still requiring oversight and lacking integration with other systems.

  • Level 3: Continuous Integration (CI)
    Integration of automated builds and tests ensures that code changes are validated promptly, laying the groundwork for continuous delivery.

  • Level 4: Continuous Delivery (CD)
    Automated deployments to staging environments enable rapid and reliable releases, with manual approval gates for production deployments.

  • Level 5: Continuous Deployment
    Fully automated deployments to production environments occur without manual intervention, ensuring rapid delivery of new features and fixes.


🛠️ Key Tools Facilitating Deployment Automation

Several tools have become integral to achieving deployment automation maturity:

  • Terraform
    An open-source infrastructure as code tool that enables the provisioning and management of cloud resources through declarative configuration files.

  • Ansible
    A configuration management tool that automates application deployment, configuration management, and orchestration tasks.

  • Spinnaker
    A multi-cloud continuous delivery platform that facilitates the release of software changes with high velocity and confidence.(The CTO Club)

  • Argo CD
    A declarative, GitOps continuous delivery tool for Kubernetes that synchronizes application state with Git repositories.(Fynd Academy)


📈 Case Study: Verizon Media's Journey to Deployment Automation

Verizon Media faced significant challenges in managing a rapidly growing infrastructure with a lean team. By adopting Ansible, they achieved a 65% increase in efficiency, automating numerous tasks and reducing manual errors. This transformation enabled them to manage a vast number of servers effectively, demonstrating the tangible benefits of deployment automation. (Cprime)


📊 Visualizing Deployment Automation Maturity

 Brochure, DevOps, Automation, Software Testing, Computer Software, Test ...

This diagram illustrates the progression through the deployment automation maturity levels, highlighting the increasing automation and integration at each stage.


📚 Conclusion: Embracing Deployment Automation for DevOps Success

Deployment automation is not merely a technical enhancement but a strategic imperative in the journey toward DevOps maturity. By systematically advancing through the maturity levels and leveraging the appropriate tools, organizations can achieve faster, more reliable, and scalable software delivery.


📅 Next in the Series:
“From Logs to Insight: Telemetry and Observability at Scale”

Wednesday, August 18, 2021

BPA Systems: Real-World Use Cases Across Industries

Introduction

Business Process Activity Monitoring (BPA) systems are not just theoretical tools. They are real-world enablers of operational excellence across sectors. Whether it's managing supply chains, safeguarding patient health, or tracking financial transactions, BPA platforms provide actionable insights that enhance efficiency and compliance. In this post, we explore practical use cases across industries—highlighting how organizations are driving measurable value through real-time process monitoring.


1. Retail and Supply Chain Management

Challenge:
Retail and logistics operations are highly dependent on timely execution of tasks like order fulfillment, shipping, and returns processing. Delays or failures can lead to stockouts, customer dissatisfaction, and revenue loss.

BPA Solution:
The SCM BPA Monitoring System captured real-time data across the order-to-delivery lifecycle. Events such as order creation, inventory allocation, shipping confirmation, and return initiation were monitored using Apache Kafka and Flink.

Impact:

  • Reduced order-to-ship delays by 35%

  • 24/7 SLA compliance tracking

  • Alerts triggered for shipment delays, warehouse bottlenecks, and returns exceeding thresholds

Visual:
Retail Supply Chain Dashboard


2. Healthcare and Patient Monitoring

Challenge:
Hospitals and clinics rely on tightly coordinated processes for patient intake, treatment, discharge, and insurance claims. Lack of real-time visibility can delay treatment or compromise compliance.

BPA Solution:
BPA platforms integrate with Electronic Health Record (EHR) systems to monitor:

  • Patient admission and discharge events

  • Prescription order workflows

  • Lab result turnaround times

Impact:

  • Reduced time-to-treatment for emergency admissions by 20%

  • Alerted nursing staff to pending medication administration

  • Provided compliance reporting for audit readiness

Example Alert: "Lab results pending > 45 minutes for emergency patient in Room 305."


3. Financial Services and Compliance

Challenge:
Banks and insurance companies must monitor financial transactions for fraud, AML (Anti-Money Laundering) compliance, and process adherence in loan origination or claims processing.

BPA Solution:
A real-time BPA system tracks:

  • KYC (Know Your Customer) verification workflows

  • Credit decision timelines

  • Transaction anomalies and rule violations

Impact:

  • Detected and flagged high-risk transactions in under 2 seconds

  • Improved compliance with regulatory SLAs (e.g., 24-hour dispute response)

  • Enhanced internal audit traceability

Visual:
Finance Compliance Dashboard


4. Manufacturing and Production Monitoring

Challenge:
Production lines involve multiple automated and manual stages. Monitoring efficiency, downtime, and quality issues in real time is critical.

BPA Solution:
Sensors and control systems feed data into the BPA system, which monitors:

  • Machine uptime/downtime events

  • Production step completion rates

  • Quality control failure rates

Impact:

  • Reduced unplanned downtime by 28%

  • Real-time alerts for bottlenecks in assembly lines

  • Prevented shipping of defective batches with automated quality checkpoints

Example Dashboard Widget: Downtime by Machine - Heatmap by Production Zone


5. Telecom and Customer Support Operations

Challenge:
Customer onboarding, service activation, and support request handling involve complex workflows that can span multiple teams.

BPA Solution:
Monitor customer lifecycle events:

  • Account provisioning

  • Ticket resolution times

  • Escalation handling SLAs

Impact:

  • Reduced first-response times by 40%

  • Improved NPS by tracking and acting on unresolved tickets in real time

  • Enabled root cause analysis of delayed activations

Example Alert: "New service activation delayed > 2 hours — trigger support escalation."


6. Cross-Industry: Remote Work and Workflow Automation

Challenge:
With hybrid and remote teams, ensuring visibility into business-critical processes has become more complex.

BPA Solution:
Integrated BPA systems with digital workflow tools (e.g., ServiceNow, Jira, Microsoft Power Automate) to:

  • Track approvals and project progress

  • Monitor document handling workflows (e.g., contracts, invoices)

  • Trigger reminders for missed steps or deadlines

Impact:

  • Increased process completion rate by 22%

  • Reduced document processing time by half

  • Provided audit logs for external compliance reviews


Conclusion

The power of BPA systems lies in their flexibility and adaptability. Across industries, they serve as the nervous system of business operations—monitoring, analyzing, and alerting on what matters most. Whether you’re improving hospital efficiency or tracking supply chain SLAs, BPA platforms provide the foundation for informed, timely, and strategic action.

In our next post, we’ll dive into how to design a scalable, secure, and resilient BPA platform—from architecture decisions to security best practices.

Stay tuned for Blog 5: Designing a Scalable, Secure, and Resilient BPA Platform.